Quickly Understand Your Reservoir
Reservoir models are getting larger and more complex, and the need for effective analysis and communication is becoming vitally important.
Tecplot RS helps you manage and analyze large amounts of reservoir simulation data, uncover knowledge about reservoir model behavior, and communicate your results to colleagues and management with professional images and animations.
Tecplot RS is specifically designed to streamline processes so that engineers get to their answers in just a few mouse clicks. Learn how to use “smart views” in Tecplot RS with these tutorials: Stamp Plot, History Match Bubble Plot and Recovery Map.
“Tecplot RS differs from other visualization packages on the market in several ways. Tecplot RS is easy to use, offers more capabilities, and produces better-quality images, both on screen and hardcopy.” – James Gilman, Director of Engineering at iReservoir
Quickly Validate Your Results
When you have finished running a reservoir simulation, you must be able to quickly validate your results, and make crucial decisions about your model. Visualization and analysis tools are crucial in the simulation workflow to help you fully understand your model.
Working closely with the reservoir engineers over the past 15 years, our team has carefully studied typical reservoir simulation workflows. We have designed Tecplot RS specifically to streamline processes so that you get to your answers in just a few mouse clicks.
Gain Crucial Insights through Powerful Analysis
Important information extracted from your model can give you fresh insights about reservoir behavior, leading to new discoveries. Tecplot RS has built in statistical analysis tools that pull out detailed reservoir model characteristics, for example, integrating the total oil in place for a grid solution. High quality graphics allow you to view your reservoir from many different perspectives.
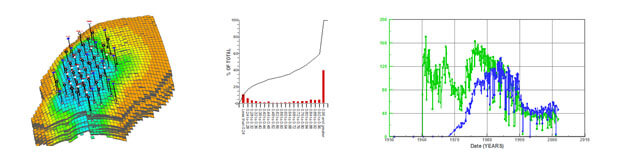
Quickly get fresh insights about reservoir model behavior.
Load Simulation Data from Many Sources
Efficient methods for loading large data sets and an and easy-to-use interface help you quickly access the views you need to comprehend your data. As a full data visualization and analysis tool, Tecplot RS is compatible with many different sources of data. This industry compatibility makes it easy to standardize your results. It also facilitates cross team communication throughout the organization.
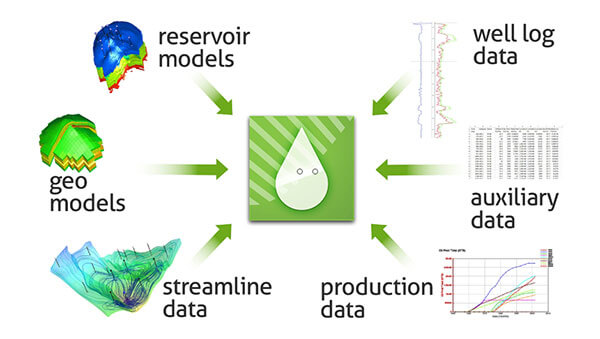
Load data from many different sources into Tecplot RS.
Responsive Technical Support
- Take advantage of new software releases twice per year. See what’s new in the latest release.
- Get response from our technical support team in one business day or less.
- Get help with installation, troubleshooting and workflow issues specific to your workplace.
- View Tecplot RS videos.
Advisory Council
Customer advisory council members (made up of our largest customers) have direct influence on the new feature design in Tecplot RS. Consulting with leaders in the oil and gas industry keeps us in sync with current issues in the industry.
The Tecplot RS Solution
Tecplot RS is an all-in-one XY, 2D and 3D solution. This one tool helps your team easily organize data results, have confidence in model predictions, collaborate across teams and communicate results to management. A short learning curve, full technical support and free online training, helps your team get up and running quickly.
What’s New in Tecplot RS 2021 R1
Release Date: November 4, 2021
The goal for Tecplot RS has always been to help make post processing workflows easier for the reservoir engineer. One of the new features in the 2021 R1 release allows you to step through entities or variables and export the plots in batch, which saves a lot of time compared to previous versions where you had to do this one by one. There have been other minor enhancements that add up to huge benefits for users as well.
Highlights of this Release:
- Batch Export of multiple entities/variables – The export dialog has been revised to include the ability to export a sequence of variables or entities in batch. Users will also be able to export multiple timesteps or properties in 2D/3D Grid data. Note that exporting from the Plot Gallery dialog will still only export static images.
- Display Matrix/Fracture Data together in RFT Plots – If matrix and fracture are included in an RFT file, both lines will now be displayed in an RFT plot.
- Matrix Fracture Delta Grid Display – Users have the option of displaying a delta grid that calculates the difference between matrix and fracture.
- Histogram and Cross Plot CSV export – Users can now export histograms and cross plots in CSV format directly from the histogram or cross plot details dialog.
- See all updates in the Tecplot RS Release Notes »
Platform Requirements |
|
| Windows Windows requires installation be run as administrator. |
64-bit (x86-64) Windows 10, 11 |
| Linux | 64-bit (x86-64) Red Hat Enterprise Linux (RHEL) 7.5+, 8.0+* SUSE Linux Enterprise Desktop (SLED) 15 Ubuntu 18.04 LTS, 20.04 LTS CentOS 7.5+, 8.0+* *CentOS 8 is at end of life 12/31/2021. Tecplot products released in 2022 will not support CentOS 8. |
System Requirements |
|
| 2GHz (64-bit) Processor 500 MB Disk Space and 4 GB RAM Minimum Display Resolution of 1280 x 960 OpenGL accelerated graphics card For more information, please read our Installation Guide in the Documentation. |
|
Operating System Support |
|
| Tecplot aims to support desktop operating systems (Windows, RedHat, SLED, Ubuntu) that are under standard maintenance by their manufacturers, and are available at the time of the release of a Tecplot product. Tecplot does not guarantee, but may choose to support, platforms which are under an extended support policy, such as Windows “Extended Support” or RedHat’s “Extended Life-cycle Support.” | |
Datasheet
History Match
- Automatically determine and display match factors for multiple simulation runs.
- Compare data from multiple runs with historical well data.
- Use delta bubbles to identify regions where the simulation over/under predicts.
- Modify properties for selected regions and output for subsequent runs.
Data Analysis
- Use cross plots to observe relationships between data.
- Use histograms to observe distribution of data.
- Calculate new variables from existing variables.
- Integrate solutions over selected ranges.
Multiple Data Sets
- Load and manage multiple data sets for comparison plots.
- Load and append data from numerous sources.
- Remove data sets that are no longer needed.
Grid Plots
- View percentage change relative to initial conditions with Recovery Map.
- Load and display inactive cells.
- Interactively select groups of cells to isolate or remove.
- Save customized color legends for each grid variable.
- Display grid variable as distinct value per cell or smoothly varying.
- Customize all text and style elements of each plot.
- Use ternary coloring to display oil, water, and gas saturations.
- Display differences between grid solutions.
- Superimpose bubble plots of well production and injection data.
- Use Delta bubbles to display difference between two well data sets.
- View production data and grid solution data together using Stamp Plot.
3D Grid Plots
- Generate 3D images of the simulation grid solutions.
- Display 3D perspective and orthographic views with light source shading.
- Rotate, translate, and zoom with mouse buttons to focus on a particular region.
- View internal 3D features like well trajectories and iso-surfaces.
- Cut away or isolate regions of the reservoir or to just show the cells along a well path.
- Create “Fence” plots from multiple intersecting grid layers, multiple x, y or z slices, or a set of arbitrary slices.
- Display fault surfaces.
- Evaluate user-specified “survey” wells.
- Sum or average properties over grid layers.
2D Grid Plots
- Examine the simulation solution, layer by layer.
- Quickly step through grid layers for aerial and cross-section views.
- Display grid layers in physical or index coordinates.
- Interactively translate and zoom on the image.
- Display wells and local grid refinements as they appear in each layer.
- Display fault lines.
Animation
- View the time history of reservoir data.
- Create 2D and 3D views for specific simulation times.
- Animate or step forwards and backwards through a time sequence to observe changes in the solution variables.
- Create and share movies showing saturation fronts, pressure changes, and other recurrent grid properties.
- Display the difference between current values and a user-selected reference time.
- Animate RFT plots through all timesteps.
Macro Language
- Access all features with macro commands.
- Create and run macros interactively to repeat sets of views for new data sets.
- Create and edit macro scripts to batch process data from multiple simulation runs.
Whether you’re a single user or you’re supporting an international team of engineers, Tecplot licensing gives you flexible and cost-effective options. We offer several commercial license types to fit any size and kind of organization. We also have academic licensing.
- Call Tecplot at 800.763.7005 or 425.653.1200
- Email sales@tecplot.com
Q: What versions of Tecplot software do you currently support?
Technical support is offered to license holders who have a current TecPLUS™ subscription for software releases delivered in the current year and the past two calendar years. Installation-only support is offered to license holders who do not have a current TecPLUS™ subscription for software releases delivered in the current year and the past two calendar years.
Q: How can I get a license key needed to run Tecplot software?
Single-user licenses for Tecplot software released in 2016 or later can be activated with an Activation Code. The Activation Code is provided to you when you purchase or renew your TecPLUS service for a single-user license. Once the Tecplot installation has finished, you will be asked to enter in the Activation Code on your first start-up.
A license key file is required to run Tecplot Software released before 2016, Network licenses, or if you do not have an internet connection.
Q: Do I need to install my license key after I receive it?
Current Tecplot network licenses require an installation of a Reprise License Manager (RLM). Single-user Tecplot licenses do not.
Q: How do I install my license key after I receive it?
After you install your software, you will need to activate it.
Instructions are available in the activation_instructions.html file located in the directory where Tecplot is installed.
Complete details about Tecplot Licensing are available in the Installation Guide for your product. This is located in the Doc folder where Tecplot is installed and on our website documentation.
Q: I installed the trial version, do I need to uninstall it before installing my purchased version?
You do not need to uninstall the trial version. The installation of Tecplot software remains the same regardless of the license type.
Q: If I want to install Tecplot software on a new computer, is a new license key required?
The answer depends on which type of license you have.
Single-user license
If you have a Single-User license, you will need to submit a License Transfer Request from our customer portal, My Tecplot (link at the top of page). Once that is complete you can use your Activation Code to obtain a key for your new computer. If you are not using an Activation code, you can generate a new license key from My Tecplot or by contacting Technical Support.
Network license
If you have a network license, you will not need a new license key. Install your software on the new computer, choose the network install mode, and include your license server name when prompted. Your software should run successfully as long as your license manager is set up correctly.
Q: Can multiple versions of Tecplot software be run on the same computer?
Yes, multiple versions of Tecplot software can run on the same computer. Similarly, Tecplot 360, Tecplot Focus, Tecplot RS can be run on the same computer.
Q: Can Tecplot 360, Tecplot Focus, and Tecplot RS be run on the same computer?
Yes, the products can run on the same computer without conflicting with each other.
Q: Can Tecplot Software be run on a virtual machine?
With a network license, Tecplot software can be run on a virtual machine.
A single-user license key does not allow running on a virtual machine. If you need to use Tecplot software on a virtual machine with a single-user license, please email Technical Support to discuss your situation.
Q: Where do I download the latest software version?
Visit our Customer Portal, My Tecplot at the link in the top menu to access software downloads.
Q: How can I get started using Tecplot RS?
You can start using Tecplot RS by opening the application and loading the sample files provided to see what a plot can look like.
- Open Tecplot RS
- Load example files
- Click the Load XY Data or Load Grid Data button on the toolbar (or choose Load XY Data or Load Grid Data from the Project menu) to open a loading dialog.
- In the Load XY Data or Load Grid Data dialog, Click the Browse button
- Navigate to the examples folder included in your installation (by default on Windows platforms, this folder installs to C:\Program Files\Tecplot\TecRS 2019 R1\examples\). Use the year and version number of your software for the correct directory.
- If you chose to load XY data, choose a unified summary file (*.unsmry), such as chelan.unsmry, to load. Tecplot RS will load that file as well as its related files.
- If you chose to load grid data, choose a grid file (*.grid), such as chelan.grid, to load. Tecplot RS will load that file as well as its related files.
- Use the tools in the toolbar to experiment with the plot.
For other questions and to learn how to use Tecplot RS to its fullest extent, we recommend referring to the product documentation, especially the Tecplot RS User’s Manual. You can also view this information by choosing Tecplot RS Help from the Help menu.
Q: My license key is not accepted as valid even though I have a valid license. What do I do?
This means that your license key file may not be valid. Please email Technical Support
Q: Where can I get more specific technical support?
» Tecplot’s Support page has a complete list of technical support options.
Q: How much will it cost to upgrade to the newest version if I renew my license?
For customers with a current TecPLUS service, there is no charge to upgrade from an earlier version of Tecplot software. If your TecPLUS has expired, you can request a renewal.