Make Better Decisions with Tecplot 360
More CFD simulations are being run, grid sizes are getting larger, and data sets are being stored remotely. It’s essential that you have the right tools to handle large data sets, automate workflows, and visualize parametric results.
Tecplot 360 helps you spend less time waiting and more time discovering.
- Integrate XY, 2D & 3D plots and get them looking exactly the way you want.
- Communicate your results with brilliant images and animations.
- Automate the boring stuff with PyTecplot Python scripting »
- Never miss a result when analyzing parametric data with Chorus »
- Securely access large, remote data with SZL-Server client-server »
PyTecplot, Chorus and SZL-Server are available to customers with TecPLUS maintenance.
Benefits of Using Tecplot 360
Analyze Complex Results
- Load Tecplot, FLUENT, PLot3D, CGNS, OpenFOAM, FVCOM, VTU data and 22 other CFD, FEA, structural analysis, and industry-standard data formats.
- Report and compare solutions in a multi-frame environment with multiple pages.
- Understand XY, Polar, 2D and 3D plots using unique linking capabilities.
- Animate and step through transient solutions with video player-style controls.
- Explore with interactive slicing, isosurface, and streamtrace tools.
- Automatically extract key flow features such as vortex cores, shock surfaces.
Explore Billion Cell Models with SZL Technology
- Leverage multi-core desktop systems with multi-threaded capability.
- Dramatically improve performance for large finite-element data using SZL format. Benchmark for 183M cell CFD++ solution:
- Load times 7.3 times faster.
- Peak memory usage reduced by 93%.
- Files sizes compressed 50%.
- Analyze large finite-element data sets quickly and easily on a typical engineering laptop.
Verify Engineering Designs
- Assess your grid quality with 28 grid quality functions including aspect ratios, skewness, orthogonality, and stretch factors.
- Validate computational output with experimental data in by a single plotting environment.
- Estimate the order of accuracy of your numerical solutions with Richardson extrapolation analysis.
- Interactively explore and sweep through flow field to check that flow features align with the grid.
- Compare multiple models simultaneously, including Fluid-structure Interaction (FSI) visualization.
Communicate and Publish Reports
- Copy and paste images directly into Microsoft Office applications.
- Export professional, presentation-quality vector and raster formats.
- Present multiple, time-linked views of your plots with unique multi-frame layout workspace.
- Create reports using multi-page layout.
- Optimize animations for PowerPoint and the Web.
- Use LaTeX to include formulae and mathematical notation on your plots
Automate Routine Tasks
- Automate workflows, interactively or in batch, with the Python API, PyTecplot.
- Record on-screen actions directly to executable Python code
- Instantly apply a plot’s style attributes and layouts to a different set of data with layout and style files.
- Leverage 100’s of macro functions to automate common analysis and plotting tasks.
Tecplot 360 2021 R2
Release Date: October 21, 2021
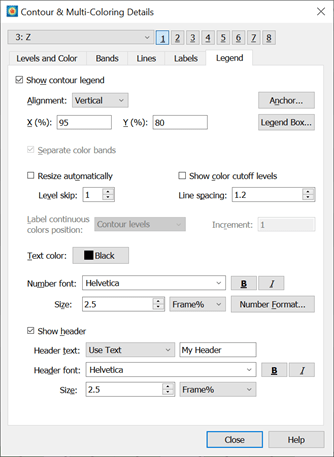
- The Contour Legend Header now allows user supplied text. You no longer need to edit variable names to change the header text. The header text supports the inclusion of auxiliary data and other text modifiers supported by Tecplot 360. This change also resulted in a reorganization of the macro language and PyTecplot APIs. Old macros and scripts are backward compatible but should be updated to use the new API calls.
- See the $!GlobalContour in the Scripting Guide
- See header in the PyTecplot documentation
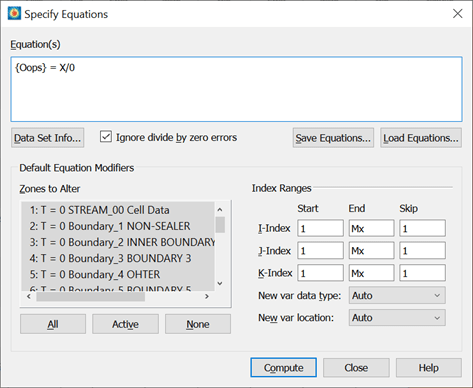
- The Data > Alter > Specify Equations dialog now has a toggle to Ignore divide by zero. When toggled on, equations will continue to process even if a divide by zero occurs. Details on resulting values are included in the User’s Manual and Scripting Guide.
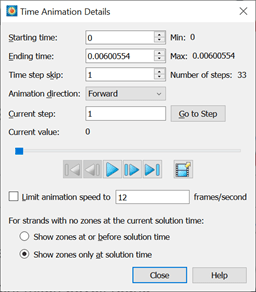
- The visibility of zones is now configurable for transient data. This fixes a problem in which zones which “disappear” during a transient simulation were still being displayed when they shouldn’t have been. Users of TecIO can use TransientZoneVisibility to set the default behavior in the data files. See Section 1-4 of the Data Format Guide.
- Added support for logarithmic time scales. Previously Tecplot 360 would treat all time scales as linear, incorrectly clustering early solution times causing multiple solution times to be rendered simultaneously. The solution time clustering options may also be used to customize solution time spacing for cases where the default settings don’t group time steps together as expected. This feature is currently only available via macros and PyTecplot and adjustments to these values are retained in layout files.
- See $!SetSolutionTimeClustering in the Scripting Guide
- See data.solution_time_clustering in the PyTecplot documentation
Enhancements
- Reduced the amount of temporary disk storage required by 99.6%! Tecplot 360’s Load-On-Demand feature would previously unload certain data to temporary storage on disk when the RAM limit (as defined by Load-On-Demand settings) is reached. Disk speed has not kept up with CPU performance, so recomputing these values has proven faster than relying on disk access. In one test – creating a movie file with simulation results which consisted of 133Gb of data spread over 720 timesteps – we saw temporary storage requirements drop from 70Gb down to only 307Mb an improvement of 99.6%! The reduced disk access also resulted in anywhere from a 3.8% to 19.7% performance improvement, depending on Load-On-Demand settings.
- Improved performance when initializing contour levels for transient datasets with a very large number of zones per time step. In testing we saw a 23.8x speed improvement over 2021 R1 for a Plot3D dataset consisting of 65004 zones with 841 million grid points. Below are the timing results to load the data, render a slice colored by Rho, change the slice to be colored by Energy. These tests were done on a Windows 10 machine with 40 logical cores and 128Gb RAM. Note that this performance improvement is more a function of the number of zones in the dataset than the size of the grid.
| Software | Elapsed Time (seconds) | Peak RAM Usage (Gb) |
| Tecplot 360 2021 R1 | 1386 | 17.2 |
| ParaView 5.9 | 339 | 44.4 |
| Tecplot 360 2021 R2 | 58.3 | 17.2 |
For all the details, read the Tecplot 360 Release Notes in our Documentation »
Tecplot Features Over Time
Customers often ask which Tecplot 360 features were released in each version of the product. We have compiled a list of the features for each release from 2014 to the present. Tecplot Features Over Time
Platform Requirements |
|
| Windows Windows requires installation be run as administrator. |
64-bit (x86-64) Windows 10, 11 |
| Mac We recommend always installing the latest OS update (run Software Update to make sure you have the latest version). |
64-bit (x86-64) 10.15, 11, 12 |
| Linux | 64-bit (x86-64) Red Hat Enterprise Linux (RHEL) 7.5+, 8.0+* SUSE Linux Enterprise Desktop (SLED) 15 Ubuntu 18.04 LTS, 20.04 LTS CentOS 7.5+, 8.0+* *CentOS 8 is at end of life 12/31/2021. Tecplot products released in 2022 will not support CentOS 8. |
System Requirements |
|
| 2GHz (64-bit) Processor 850 MB disk space and 4 GB RAM Minimum display resolution of 1024 x 768 OpenGL accelerated graphics card For more information, please read our Tecplot 360 Installation Guide in our Documentation. |
|
Operating System Support |
|
| Tecplot aims to support desktop operating systems (Windows, MacOS, RedHat, SLED, Ubuntu) that are under standard maintenance by their manufacturers, and are available at the time of the release of a Tecplot product. Tecplot does not guarantee, but may choose to support, platforms which are under an extended support policy, such as Windows “Extended Support” or RedHat’s “Extended Life-cycle Support.” For MacOS, Apple does not have a well documented OS support policy. Tecplot intends to support the current MacOS and two previous MacOS versions. | |
Datasheet
Analysis
CFD Analyzer: Examine grid quality, perform spatial integrations, generate particle trajectories, extract flow features and estimate numerical errors.
Function Calculator: Calculate over 90 grid and flow field functions. Calculate new variables using common math operations. Perform data normalization.
Integrations: Integrate over lines, surfaces and volumes. Calculate volumes, areas, flow rates, forces and moments. Apply weighting options to calculate total pressure. Integrate by time zone or time strand.
Particle Paths: Integrate particle trajectories in steady and unsteady flows. Calculate paths of particles with mass and drag effects.
Feature Extractions: Detect and extract shock surfaces, vortex cores, flow separation and reattachment lines.
Error Analysis: Estimate the order of accuracy of your numerical solutions using Richardson extrapolation analysis.
Finite Element Analysis (FEA): Derive Von Mises stress/strain, principal stresses/strains and vector magnitude. Plot the geometry with deformations and exaggerated deformations applied. Animate displacements.
Create, Alter and Transform Data: Alter data or create new data using mathematical expressions. Store mathematical expressions. Create mirror images of data. Create new data as subset of existing data. Write conditional expressions using the IF() function. Rotate and duplicate data around an axis.
Interpolate and Triangulate: Choose from linear, inverse-distance and kriging interpolation. Create sets of triangles from data points defined in a 2D plane.
Discrete Fourier Transform (DFT): Transform one- dimensional ordered linear data into the frequency domain for visualization and further analysis.
Exploration
Tecplot Chorus: Included with Tecplot 360, this tool has a unique set of features that help you explore large data sets from multiple simulations.
Slicing Tool: Interactively slice 3D and surface data displaying mesh, contours and vectors on the slice plane. Constrain the extent of a slice to user-defined ranges. Define and use up to eight different slice groups.
Iso-surface Tool: Change iso-surface values interactively. Define and use up to eight different iso-surface groups on one or more variables.
Streamtrace Tool: Interactively seed rakes of streamlines, streamrods and streamribbons in 2D and 3D. Specify lines to terminate streamlines. Display markers along streamlines spaced by vector magnitude. Auto seed streamtraces on a selected surface.
Contour Tool: Accurately control contour levels on a per variable basis and leverage up to eight contour groups in a single frame. Interactively add or delete contour lines or levels to refine variable fine structure.
Curve Fits: Use least squares linear, polynomial, power and exponential curve-fits. Use least squares curve-fit for linear combination of user-specified functions.
Data Blanking: Set multiple constraints (masks) to blank display of data based on local field variables, functions of variables and grid indices. Omit zones or peel away surfaces to highlight specific details.
Extraction Tools: Interactively define point or polyline sets to which 2D and 3D surface data is interpolated and extracted for display as a separate plot.
Unsteady Data: Load and explore time-dependent solutions with ease. Use video-like controls. Show multiple views of data through time. See current time step point value on XY plot with Time Marker. Step through and animate solution time across frames with Time Linking.
Time-series Probe: Extract single point or node over time and plot result in new frame as an XY line plot.
Extract Objects Over Time: Extract slices, iso-surfaces, streamtraces and points from polyline geometries in transient data.
Automation
PyTecplot: Tecplot’s Python API gives you the ability to access your CFD data directly and to control your workflows with one popular and easy-to-use language.
PyTecplot Recording and Connections: Record actions performed on-screen to directly runnable python code. Directly play back python in an active Tecplot 360 session.
Configuration and Batch Files: Set defaults and perform initialization with configuration files and start-up batch files.
Tecplot Macros: Use 1000’s of macro functions including loops and other common programming functions. Run macros with the click of a button by registering them in the macro sidebar.
Collaboration
Cross-Platform Capability: Run Tecplot 360 on machines running Windows, Mac OS X and Linux. Interchange Tecplot 360 macro files, layout files, stylesheets, color map files and data files between all platform types.
Extensible Data Writers: With TecIO, build custom data exporters to write data in custom formats, or use built-in tools to export Tecplot data in PLT (*.plt) or SZL (*.szplt) formats.
Working with Large Data Sets
Parallel Processing (shared memory): Leverage all available CPUs/Cores for faster computing-intensive operations, such as streamtraces, slices and iso-surfaces.
Multiple Data Sets: Create and display plots from up to 2048 different sets of data simultaneously.
Multiple Zones & Variables: Include up to 1 million segments/zones per data set, up to 1 million variables (X, Y, Z, U, etc.) per data point.
Multi-Page Layout: Create up to 2,048 plots per page.
Plot Annotation
Text: Place text interactively on plot. Use all your system fonts with TrueType capabilities. LaTeX font support allows for complex formulae and Greek characters.
Geometries: Interactively create polylines, rectangular boxes, circles, and ellipses. Duplicate, reposition and resize geometries. Modify geometries interactively and read from a file.
Images: Import JPEG, BMP, and PNG files into plots.
Output Formats
Vector-based and Raster Plot Files: Export vector- based files in Postscript, encapsulated PostScript (EPS) and Windows Metafile formats. Export raster files in PNG, JPEG, BMP and TIFF formats. Configure image resolution independent of screen resolution.
Animations: Export to Flash (SWF), MPEG-4, WMV and PowerPoint-compatible AVIs.
Data Input
- CFD Formats: Tecplot (.dat, .szplt, .plt), ANSYS Fluent CFF (.cas.h5, .dat.h5), ANSYS Fluent (.cas, .dat), ANSYS CFX, CGNS, EnSight, FLOW-3D, HDF5, OpenFOAM, PLOT3D, TRIX, VTK (.vtu, .vtm)
- Data Formats: Comma- or space-delimited ASCII, Excel (Windows only), HDF
- FEA Formats: ABAQUS, ANSYS, FIDAP Neutral, LSTC/DYNA input file, LSTC/DYNA, MSC/NASTRAN, MSC/Patran, PTC/Mechanica, SDRC/IDEAS universal, 3D Systems STL
- CONVERGE Data
- CPFD data
Line, 2D, 3D, and Polar Plotting
Time and Dates: Display on any axis.
XY Features: Create scatter plots, line plots, bar charts, semi-log plots, log-log plots, error bar plots, splines, curve-fits and more. Configure tick marks, symbols, legends and more. Work with multiple horizontal and vertical axes.
Mesh Plots: Display 1D, 2D and 3D grids. Color mesh lines by variable.
Contour Plots: Display contour lines, color flood between contour levels and color fill cells (or elements). Use multiple contour variables to view and analyze interrelationships among several variables simultaneously.
Vector Plots: Display 2D and 3D vectors on planes, 3D surfaces and in volumes. Display 3D vector components tangent to 3D surface. Specify length, color, line type and head style. Color by variable.
Polar Plot Features: Create polar line plots (r, theta). Configure angles in radians, degrees or arbitrary units. Select between linear or logarithmic radius.
Fluid-structure Interaction (FSI): Load structural analysis and CFD solutions simultaneously to see material deformation and fluid flow changes in one plot.
Request a Quote
Whether you’re a single user or you’re supporting an international team of engineers, Tecplot licensing gives you flexible and cost-effective options. We offer several commercial license types to fit any size and kind of organization. We also have academic licensing.
- Call Tecplot at 800.763.7005 or 425.653.1200
- Email sales@tecplot.com
Getting Started
Q: How can I get started using Tecplot 360?
The fastest way to get up and running with Tecplot 360 is follow the steps in Getting Started with Tecplot 360.
Your Tecplot 360 installation has an “examples” folder, which contains several sample data files in Tecplot format. To open them, go to File > Load Data File(s), select the Tecplot Data Loader, and choose a data set.
For questions on how to perform specific actions in Tecplot 360, we recommend referring to the product User Manual in our documentation.
The documentation links are also available from the Welcome Screen after you run Tecplot 360.
Q: What is the first thing I need to do in order to make the plots I want to see?
If you’re new to Tecplot 360, we recommend that you start by working through the tutorials provided in the Getting Started Guide included in your installation, or see the product documentation. Also visit Getting Started with Tecplot 360.
Downloading and Upgrading Software
Q: Where do I download the latest software version?
Tecplot 360 can be downloaded through our customer portal, My Tecplot link in the top menu. You will be prompted to log in to access the software downloads. If you do not already have an account, you can request one.
Q: How can I get a Mac version of Tecplot?
Supported Mac versions of Tecplot 360 software can be downloaded from our customer portal, My Tecplot (link at the top of page).
Automation (PyTecplot, Macros and Add-ons)
How do I use PyTecplot, the Python API in Tecplot 360?
PyTecplot docs, videos and FAQs are all on a separate web page dedicated to PyTecplot »
Q: How do I export an image when I have hundreds of zones?
If you have hundreds of zones it can be time consuming to switch to each zone and export an image. Macros can be used here to automatically activate each zone in succession and export an image.
- Scripting > Record Macro,
- Activate a zone,
- Export image
- Stop recording.
Then edit the macro file using a text editor and encase the export and activate call in a LOOP and ENDLOOP. Check the Scripting Guide in our documentation for additional information about these commands.
Q: Will macros and add-ons be compatible with Tecplot 360 EX?
Newer Tecplot 360 versions are backwards compatible with earlier versions of Tecplot 360.
- TecIO files are compatible with all versions of Tecplot 360.
- Add-ons will have to be recompiled. They are source compatible, but the libraries will need to be updated.
- Existing Macros are compatible with earlier Tecplot 360 versions. However, Macros created with Tecplot 360 2014 and later are not backwards compatible with earlier versions.
Technical Support, Versions, Maintenance
Q: What versions of Tecplot software do you currently support?
Technical support is offered to license holders who have a current TecPLUS™ subscription for software releases delivered in the current year and the past two calendar years. Installation-only support is offered to license holders who do not have a current TecPLUS™ subscription for software releases delivered in the current year and the past two calendar years.
Q: Can my older version of Tecplot 360 read .szplt format?
Newer Tecplot 360 versions are backwards compatible with earlier versions of Tecplot 360.
Versions of Tecplot 360 released before 2014 cannot read SZL (.szplt) file format. We recommend updating to the newest version.
Q: How do I set-up transient (time-varying) animation in Tecplot 360?
The Edit Time Strand tool can be used to set-up your data to be recognized as Transient. A Strand and SolutionTime will need to be assigned for each zone. Zones that are active at the same time step need to share SolutionTime, but have different Strand IDs.
Q: Where can I get more specific technical support?
Tecplot’s Support page has a complete list of technical support options.
Platforms and Requirements
Q: What platforms does the latest version of Tecplot 360 support?
Platforms supported by the latest version of Tecplot 360 are listed in the Requirements tab. You can also find requirements in the Installation Guide in our documentation or linked from the Tecplot 360 Welcome Screen.
For older versions, refer to the install.pdf file in the Tecplot 360 installation folder.
Q: What versions of Tecplot software do you currently support?
Technical support is offered to license holders who have a current TecPLUS™ subscription for software releases delivered in the current year and the past two calendar years. Installation-only support is offered to license holders who do not have a current TecPLUS™ subscription for software releases delivered in the current year and the past two calendar years.
Product Releases and SZL Technology
Q: What new features does the latest version of Tecplot 360 include?
Tecplot 360 version and features are listed on our Features Over Time.
If you are running an older versions, you can refer to the release.pdf file in your Tecplot 360 installation folder.
Q: What is SZL(subzone load-on-demand) technology?
SZL stands for subzone load-on-demand. It is our proprietary technology that increases memory efficiency by combining data management algorithms, advanced data requirement predictors, parallelization and additional code optimizations.
Resources that explain the technology and the application of SZL can be found on the SZL Technology page.
Installation and Running Multiple Versions
Q: I installed the trial version, do I need to uninstall it before installing my purchased version?
You do not need to uninstall the trial version. The installation of Tecplot software remains the same regardless of the license type.
Q: If I want to install Tecplot Software on a new computer, is a new license key needed?
The answer depends on which type of license you have.
Single-user license
If you have a Single-User license, you will need to submit a License Transfer Request from our customer portal, My Tecplot (link at the top of page). Once that is complete you can use your Activation Code to obtain a key for your new computer. If you are not using an Activation code, you can generate a new license key from My Tecplot or by contacting Technical Support.
Network license
If you have a network license, you will not need a new license key. Install your software on the new computer, choose the network install mode, and include your license server name when prompted. Your software should run successfully as long as your license manager is set up correctly.
Q: Can multiple versions of Tecplot software be run on the same computer?
Yes, multiple versions of Tecplot software can run on the same computer. Similarly, Tecplot 360, Tecplot Focus, Tecplot RS can be run on the same computer.
Q: Can Tecplot 360, Tecplot Focus, and Tecplot RS be run on the same computer?
Yes, the products can run on the same computer without conflicting with each other.
Q: Can Tecplot softare be run on a virtual machine?
With a network license, Tecplot software can be run on a virtual machine.
A single-user license key does not allow running on a virtual machine. If you need to use Tecplot software on a virtual machine with a single-user license, please email Technical Support to explain your situation.
Q: After installation, the box for inputting the key is blocked. How can I get my Key?
You can get a license key through our customer portal, My Tecplot (link at the top of page).
How to Purchase & License Renewal
Q: How much will it cost to upgrade to the newest version if I renew my license?
For customers with a current TecPLUS service, there is no charge to upgrade from an earlier version of Tecplot software. If your TecPLUS has expired, you can request a renewal.
Q: Where can I buy Tecplot Software?
In the U.S. and Canada, please call our sales engineers at 1.800.763.7005 or email us at sales@tecplot.com. You can also use the online request a quote form.
In other regions of the world, you can buy Tecplot 360 from one of our international distributors.
Licenses and License Keys
Q: How can I get a license key needed to run Tecplot software?
Single-user licenses for Tecplot software released in 2016 or later can be activated with an Activation Code. The Activation Code is provided to you when you purchase or renew your TecPLUS service for a single-user license. Once the Tecplot installation has finished, you will be asked to enter in the Activation Code on your first start-up.
A license key file is required to run Tecplot Software released before 2016, Network licenses, or if you do not have an internet connection.
Q: Do I need to install a license manager to run Tecplot software?
Current Tecplot network licenses require an installation of a Reprise License Manager (RLM). Single-user Tecplot licenses do not.
Q: How do I install my license key after I receive it?
After you install your software, you will need to activate it.
Instructions are available in the activation_instructions.html file located in the directory where Tecplot is installed.
Complete details about Tecplot Licensing are available in the Installation Guide for your product. This is located in the Doc folder where Tecplot is installed and on our website documentation.
Q: My license key is not accepted as valid even though I have a valid license. What do I do?
This means that your license key file may not be valid. Please email Technical Support